
Applied Data Science and Visual Analytics

Data Science aims at discovering patterns and models of human behavior across the various social dimensions, extracting multi-dimensional patterns and models from a vast variety of social data.
Data Science may have a potentially high impact and may generate enormous value to society. It can create new opportunities to understand complex aspects, such as mobility behaviors, economic and financial crises, the spread of epidemics, the diffusion of opinions and so on.
At KDD Lab we took the opportunities to challenge real-world analytical problems in order to advance the state of the art of data science methods and to acquire new problems to be solved. Our approach is strongly linked to data sources that we are able to collect and integrate to form a knowledge base that can be exploited for the analytical task at hand.
During these last decades, we have been working within a multi- and inter-disciplinary context, with many partners coming both from the industry and the academia.
We collected and build a vast library of datasets, that have been used within the research community and for education activities.
Case studies
Sport Data Science
Migration Studies
Well-being
Visual Analytics
The effective graphical presentation of information is an essential step in the data science process. Visualization is intended to clearly convey and communicate information through graphical means, enabling everyone to comprehend data in a much more explicit way. Visual Analytics methods may enhance the analytical tasks by providing efficient representation to explore data and models or to explain and disseminate the results of the analyses. Through visualization, the results of data processing are made more accessible, straightforward, and user-friendly, even for those who have no specific technical or domain knowledge.
Case Studies
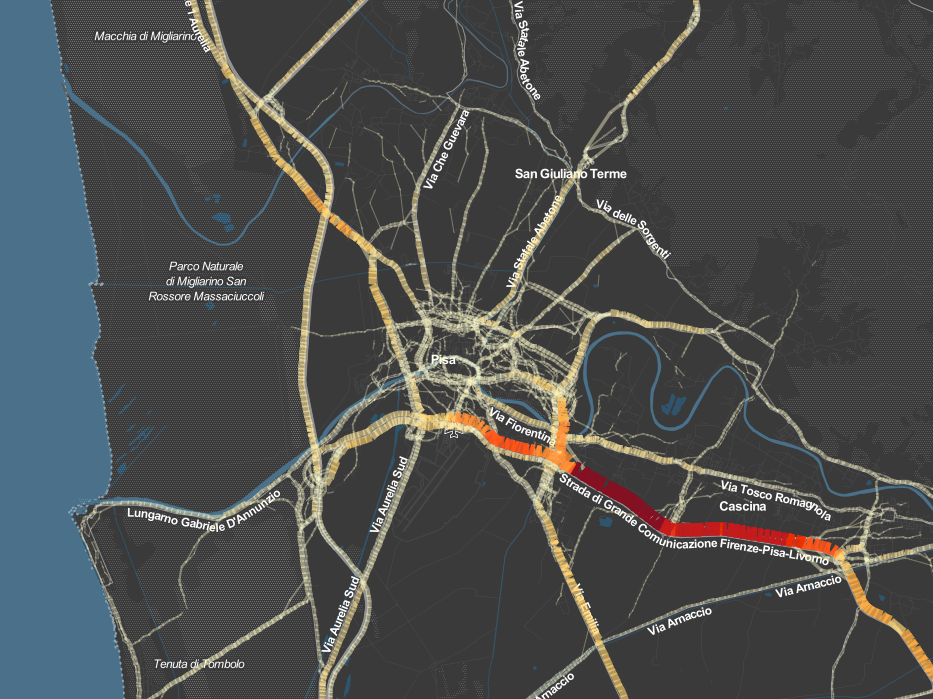
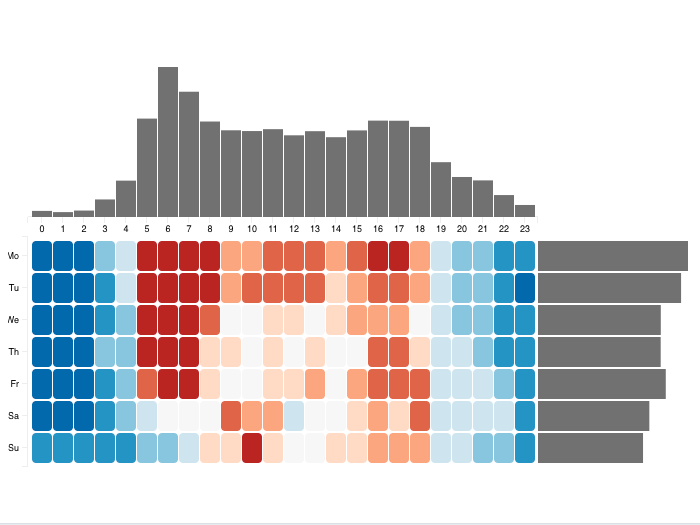
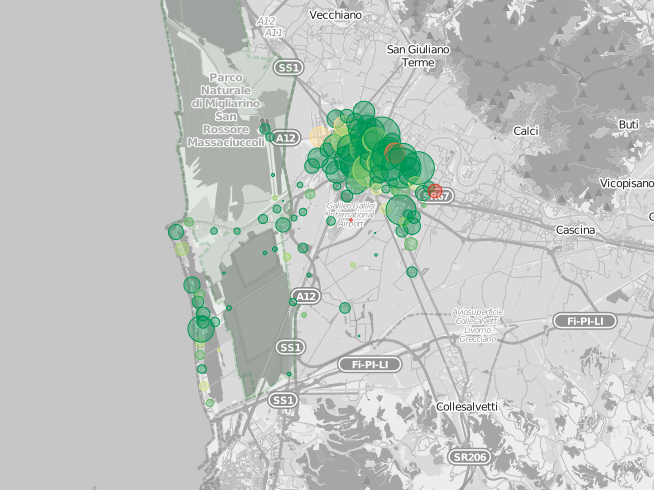
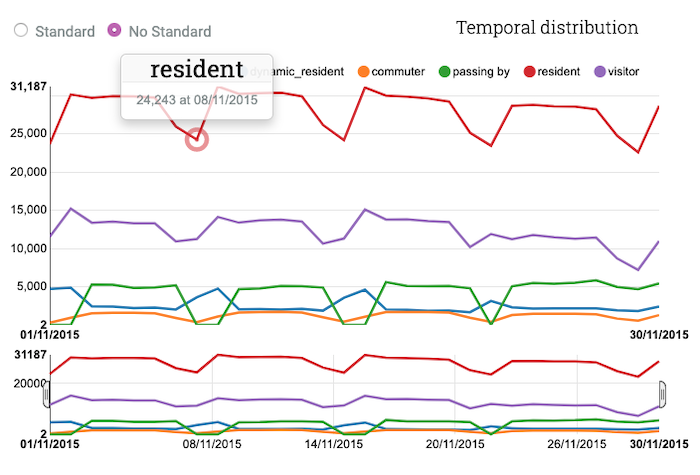
Urban Mobility Atlas
Link: https://kdd.isti.cnr.it/uma2
Mobility Atlas Booklet
We introduce a paradigm where complex analytical processes are summarized into a set of quantitative estimators of the main properties of mobility in a territory. We call such estimators mobility indicators and, for each region, we pre-compute a selection of measurements to provide a general overview of the mobility. Mobility Atlas Booklet is designed as an analytical service for policymakers, businesses, public administrations, and individual citizens. The tool makes territorial information accessible through an API system and a set of easily navigable dashboards
Link: https://kdd.isti.cnr.it/mab/
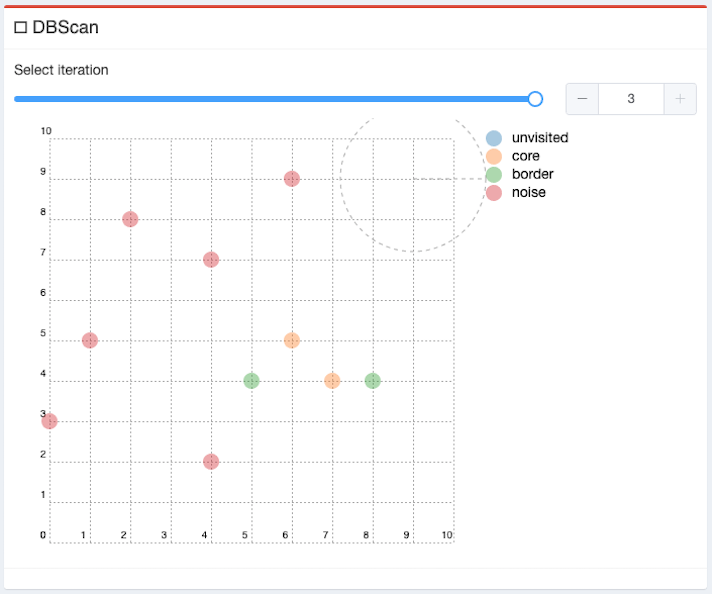
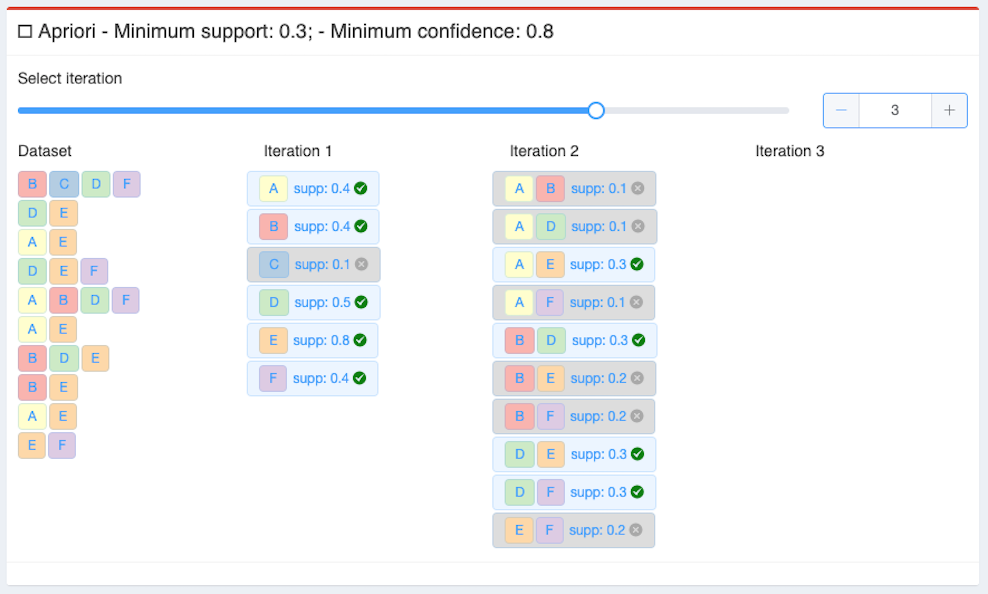
Didactic Data Mining Environment
DDME provides a collection of data mining algorithms ranging from clustering to classification to association rules. Every algorithm allows the user to tune the parameters mainly affecting the algorithm behavior. DDME algorithms can be run on custom datasets as well as on random datasets that can be generated using functionalities offered by the library. The innovative aspect of DDME is that running a data mining algorithm in such an environment provides the intermediate results for each step of the algorithm execution. These results are provided in an intelligible way using text or images, showing the value of a formula or a particular assignment. In this way, the DDME user can learn how algorithms work and why a result is returned with respect to certain parameters or settings.
Link: https://kdd.isti.cnr.it/ddm/
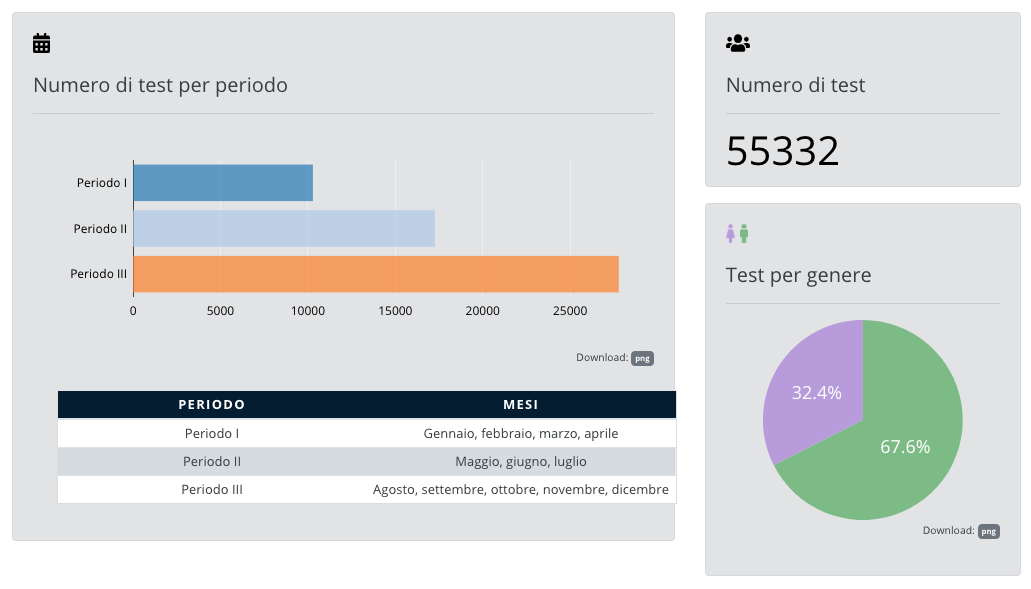
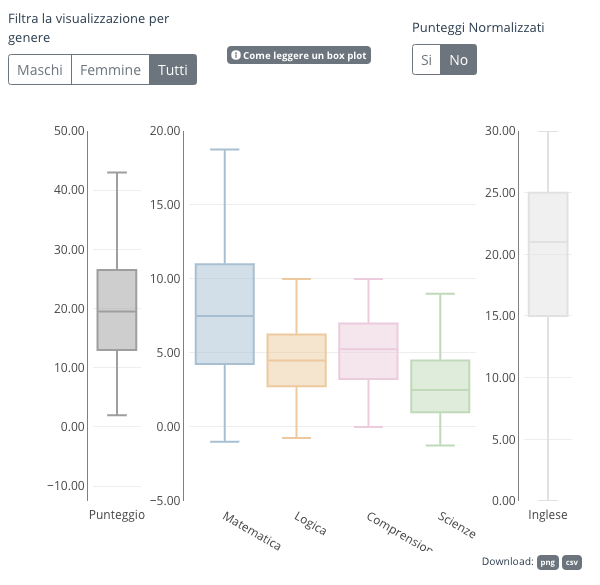
CISIA VIZ
Link: https://www.cisiaonline.it/area-tematica-cisia/visualizza-report/
NDLib Viz
Link: [no link available]
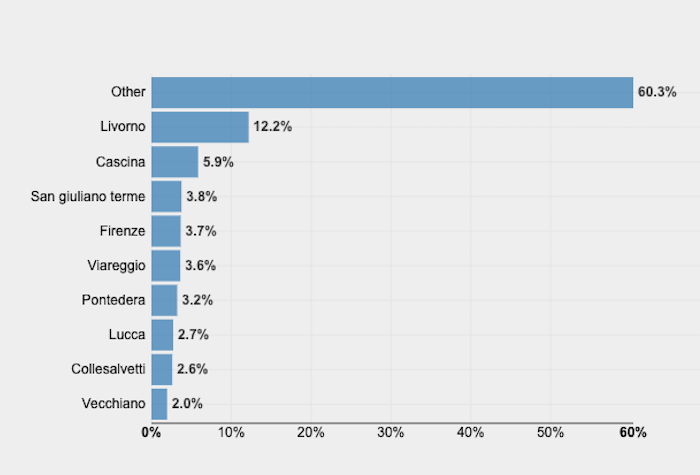
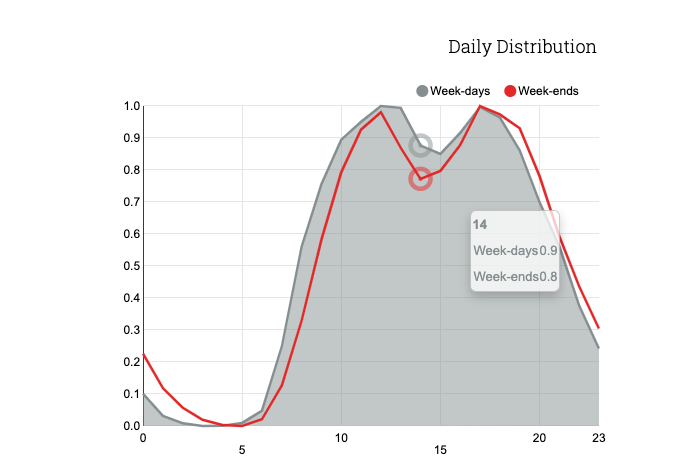
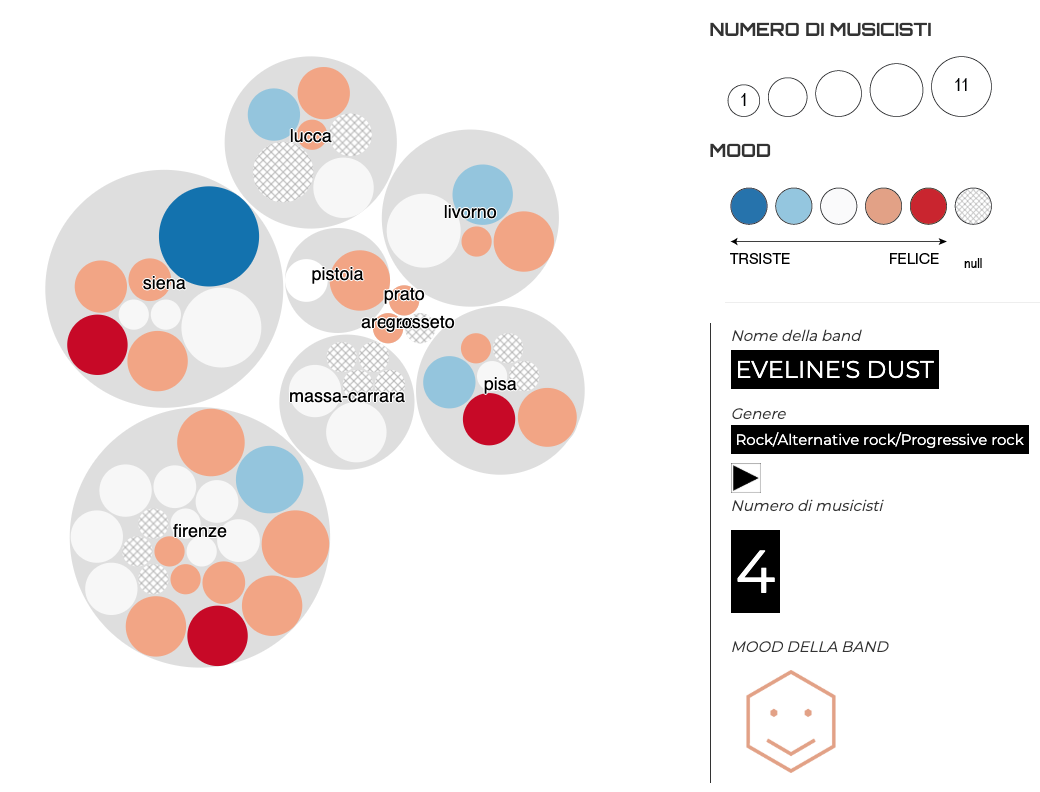
100Band
Link: https://kdd.isti.cnr.it/~pollacci/100band/
Projects
Publications
2022
-
, “GET-Viz: a library for automatic generation of visual dashboard for geographical time series”, 8th International Conference on Computational Social Science (IC2S2). Chicago, USA, 2022.
-
, “The long-tail effect of the COVID-19 lockdown on Italians’ quality of life, sleep and physical activity”, Scientific Data, vol. 9, pp. 1–10, 2022.
2021
-
, “Explaining the difference between men’s and women’s football”, PLOS ONE, vol. 16, p. e0255407, 2021.
2020
-
, “Analysis and Visualization of Performance Indicators in University Admission Tests”, in Formal Methods. FM 2019 International Workshops, Cham, 2020.
-
“(So) Big Data and the transformation of the city”, International Journal of Data Science and Analytics, 2020.
-
, “Human migration: the big data perspective”, International Journal of Data Science and Analytics, pp. 1–20, 2020.
2019
-
, “Meaningful explanations of Black Box AI decision systems”, in Proceedings of the AAAI Conference on Artificial Intelligence, 2019.
-
, “Algorithmic bias amplifies opinion fragmentation and polarization: A bounded confidence model”, PloS one, vol. 14, p. e0213246, 2019.
-
, “Analysis of the Impact of Interpolation Methods of Missing RR-intervals Caused by Motion Artifacts on HRV Features Estimations”, Sensors, vol. 19, p. 3163, 2019.
-
, “A public data set of spatio-temporal match events in soccer competitions”, Scientific data, vol. 6, pp. 1–15, 2019.
-
, “PlayeRank: data-driven performance evaluation and player ranking in soccer via a machine learning approach”, ACM Transactions on Intelligent Systems and Technology (TIST), vol. 10, pp. 1–27, 2019.
-
, “Relationship between External and Internal Workloads in Elite Soccer Players: Comparison between Rate of Perceived Exertion and Training Load”, Applied Sciences, vol. 9, p. 5174, 2019.
-
, “Do “girls just wanna have fun”? Participation trends and motivational profiles of women in Norway’s ultimate mass participation ski event”, Frontiers in Psychology, vol. 10, p. 2548, 2019.
2018
-
, “The Fractal Dimension of Music: Geography, Popularity and Sentiment Analysis”, in International Conference on Smart Objects and Technologies for Social Good, 2018.
-
, “Effective injury forecasting in soccer with GPS training data and machine learning”, PloS one, vol. 13, p. e0201264, 2018.