
Mobility Data Mining for Science of Cities

The quick evolution and wide diffusion of technologies for the localization of devices (especially smart-phones and vehicles’ GPS) as well as location-based services, is leading to the production and collection of large and diversified traces of human mobility, every day more detailed and pervasive. These traces potentially contain a huge amount of information that might allow to infer models of human mobility spaces at unprecedented levels of precision and depth. They would be key enablers of many applications, ranging from monitoring urban traffic features to reconstruct inter-city mobility demands and region-scale structures, which could help in making modern urban spaces more sustainable, efficient and comfortable for citizens.
The KDD Lab has been pursuing these objectives since early 2000’s, working at several levels:
- Developing Fundamental analytical tools, especially methods and algorithms for converting raw mobility traces into coherent objects to analyze, and then extract higher-level statistics, frequent regularities and models.
- Developing Individual Mobility Modeling, i.e. methods and algorithms to build individual-specific models that capture the key features and structure of users’ mobility.
- Building Applications on Smart Cities and Demography, especially through tight collaboration with public bodies and companies devoted to measure, manage and plan mobility at urban and regional scales.
- Designing and implementing Software platforms and dashboards to bring the analytical power provided by our tools closer to the domain experts and end users.
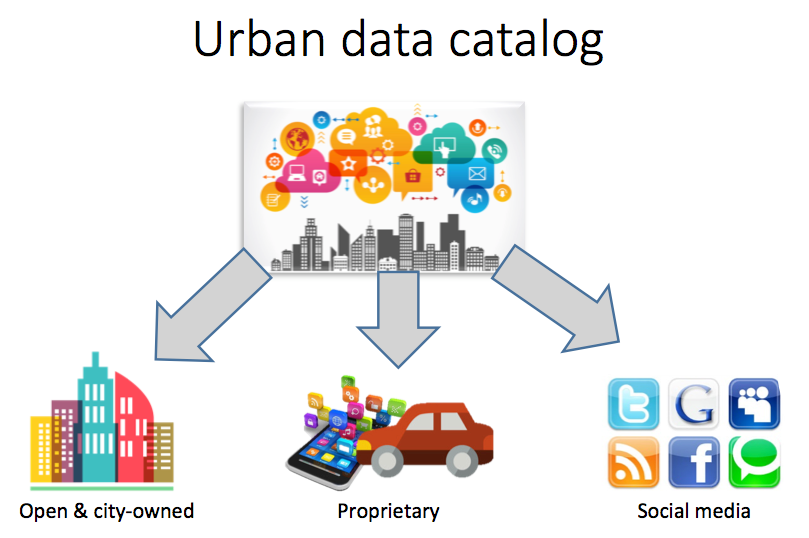
The research on these topics leverages several types of data sources, the key ones being individual GPS traces (from vehicles or smart-phones) and mobile phone data records, but also including open and city-owned data (e.g. traffic sensors, bike-sharing usage) and social media (geo-localized tweets, Flickr photos, Foursquare check-ins).
Fundamental Analytical Tools for Mobility Data
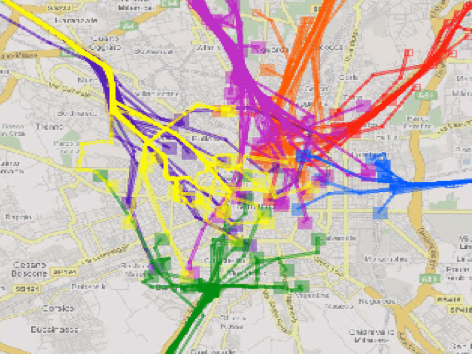
KDD Lab developed several methods for processing and analyzing mobility data, starting from Trajectory Reconstruction (i.e. translating sequences of single location fixes into a complete movement trajectory, possibly including map-matching) to the reconstruction of mobility demand models (the so-called Origin-Destination Matrices) and the extraction of various types of complex patterns or models. Important examples of this kind include clustering trajectories into groups of similar trips (T-Clustering) or extracting frequent sequences of places that show recurrent traversal times (T-Patterns).


Also, classification and prediction problems have been tackled, yielding Mobility Prediction methods for predicting future movements of a user, an Activity Recognition approach to associate to each trip of a user its most likely purpose (work, shopping, etc. in case of on-ground applications, and sailing, fishing, etc. in case of applications for the sea).
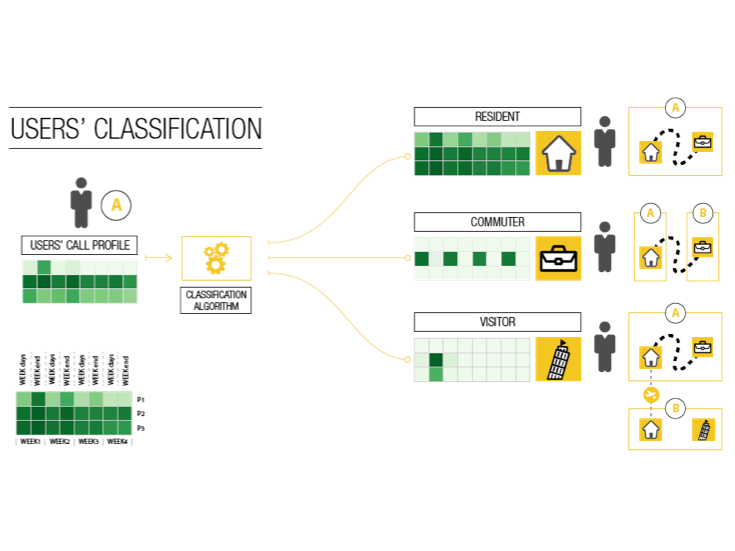
Finally, a family of classification methods specific for CDR data were realized, named Sociometer, to associate to each user its city user status in a given area, such as resident, commuter and visitor.
Individual Mobility Modeling
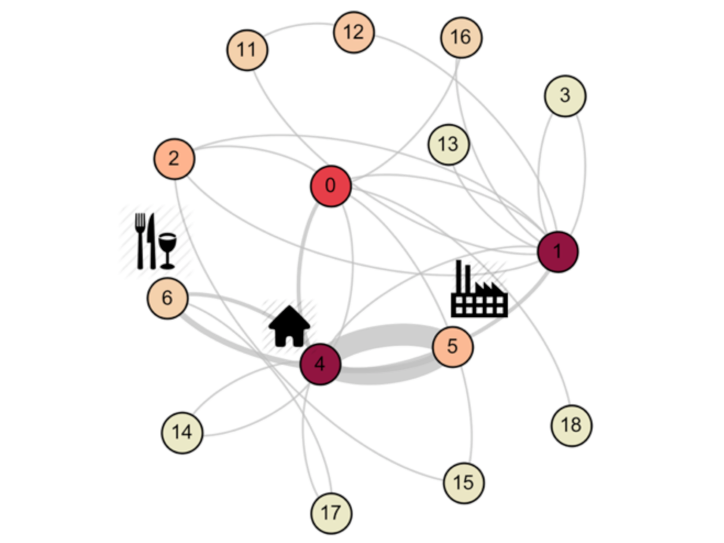
A key line of research of KDD Lab consists in building mobility models centered on the individual, capturing features at various levels of details, and thus adding semantics to the raw mobility data available. One main result on this direction are Mobility Profiles, which model the systematic component of the individual mobility, thus capturing routines and commuting patterns that turns to be very useful in several applications and also in improving mobility prediction models. Individual Mobility Networks represent the next stage in this process, and model the whole mobility of the individual, capturing relevant locations, frequent and infrequent trips, temporal regularities and many other aspects that are essential, for instance, in creating realistic simulations as well as enabling activity recognition algorithms (see the Analytical Tools of the previous section). Individual Mobility Networks also form the basis for various general mobility models and simulations, for instance the explorers and returners model, which discriminates between highly regular users and more complex ones.

Applications on Smart Cities and Demography
Driven by concrete problems and domain experts, the KDD Lab faced several applicative problems that required to deploy the analytical equipment discussed above and extend it with ad hoc solutions.
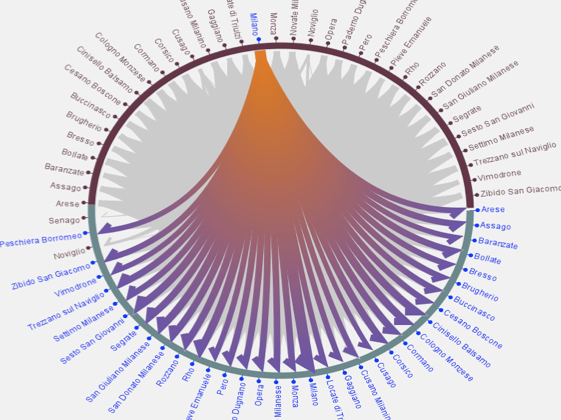
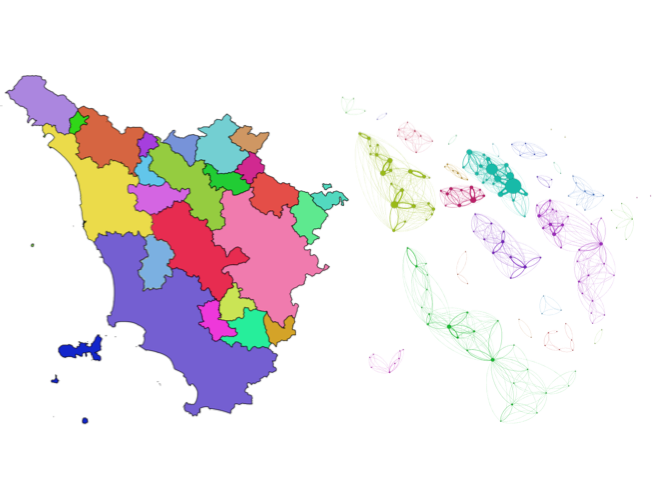
By analyzing mobility at regional scale, a few methods (the main ones being Polycentrometer & Borders) have been developed to infer a partitioning of the territory driven by mobility, which favors the integration of highly connected areas. The process also highlights the inner structure of each area, distinguishing for instance those revolving around a single hub and those with several centers.
Integrating trajectory analysis with energy consumption models, the impact that adopting electrical vehicles can have on individual mobility was studied, discovering that most users could move to electric without changing any habit.
Again on the theme of sustainable mobility, carpooling has been studied, by developing methods to evaluate the ride sharing potential of a community of users based on their mobility traces. Also, an application of pro-active carpooling has been designed and tested (in vitro).
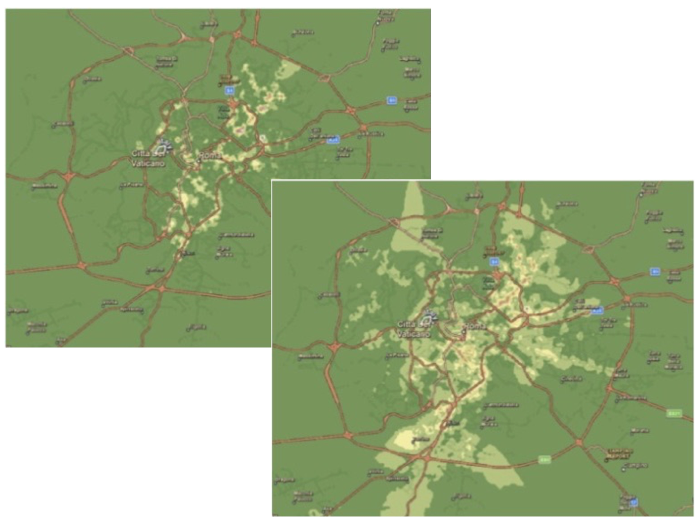
The effectiveness of a public transport system has been measured by performing Reachability Analysis of the territory with time constraints, such as “which places could I reach in 1 hour starting from here”.
Finally, several applications have been realized by deploying the Sociometer tool for city users classification based on mobile phone traces. Examples include the construction of a map of the municipalities that press on a given territory through commuting flows, as well as an effective detection and analysis of unexpected events in a city.

Software Platforms & Dashboards
Several tools and results obtained by the KDD Lab have been collected and organized into two systems that are open to use for researcher and domain experts:
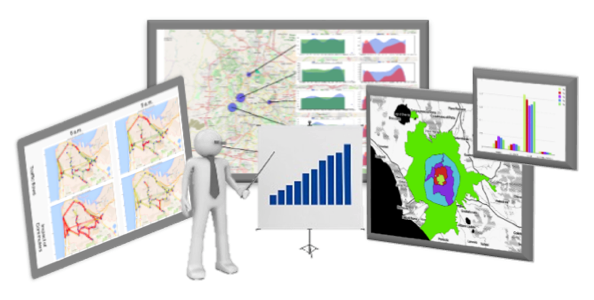
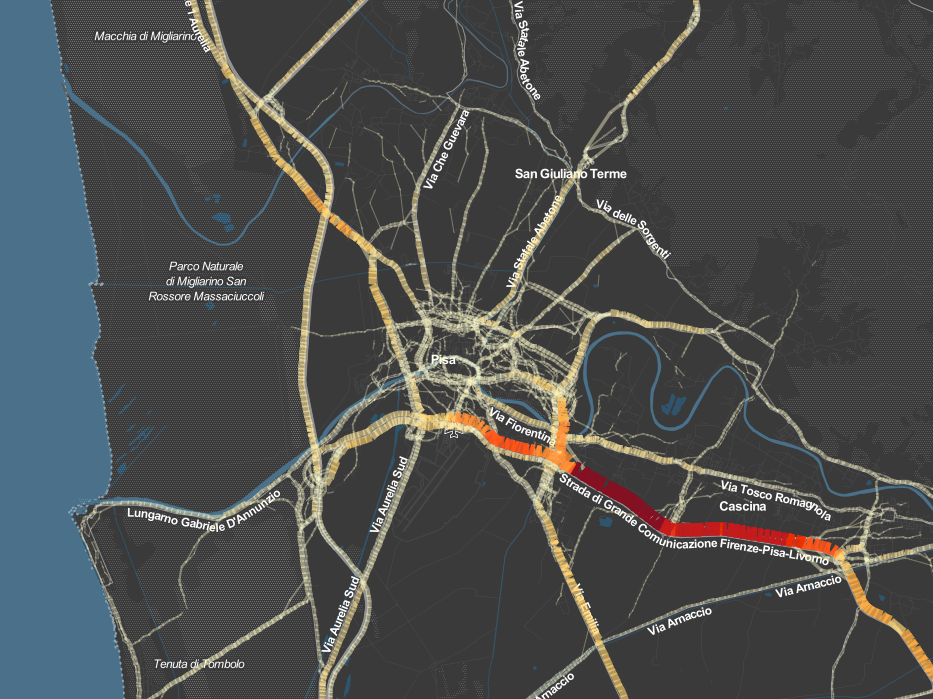
Urban Mobility Atlas: this is a dashboard that integrates several analysis performed on a large dataset of GPS trajectories over the Tuscany region, in Italy. The user can access several statistics, spatial and temporal distributions and patterns relative to each single municipality of Tuscany, through an interactive interface.
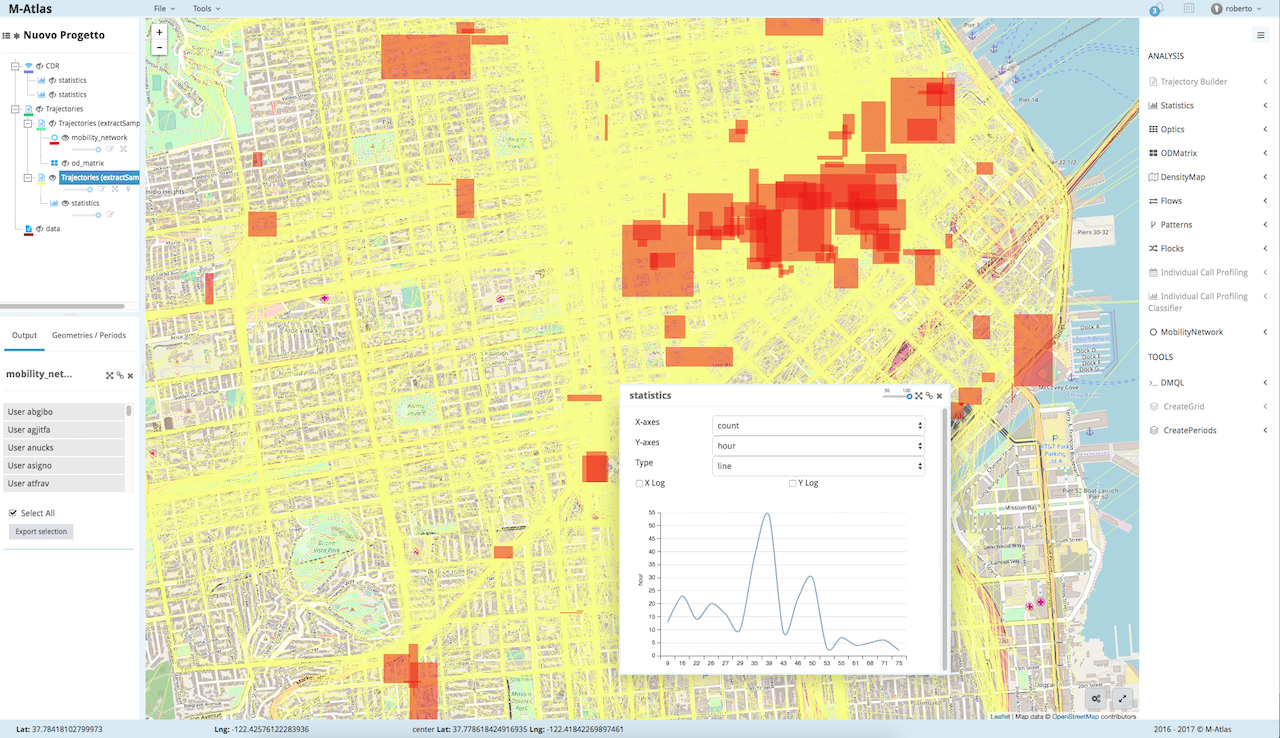
M-Atlas: this is a complete analytical platform specifically designed to deal with mobility data, and GPS traces in particular. The platform allows to build, through a GUI, analytical processes through the integration of GPS data processing and several mobility mining tools. All the functionalities of the system are also directly accessible through an ad hoc Data Mining Query Language.

Resources
Downloadable software:
• M-Atlas (link: http://m-atlas.eu/)
o T-Clustering
o O/D Matrix
o T-Pattern
o T-Flocks
o Density Map
o Spatio-temporal transformations
• Trajectory Builder
• Sociometer
• MyWay: trajectory Prediction
• Car Pooling Network and Allocation
• Mobility Profiles
• Individual Call Profiles and Privacy Risk Analysis
Dashboards:
• Urban Mobilty Atlas (link: http://kdd.isti.cnr.it/uma2)
• Tourist Observatory (link: http://matlaspisa.isti.cnr.it/turismo-pisa/)
All the resources above and many others relative to mobility can also be accessed through the SoBigData e-Infrastructure: freely register online (link: https://sobigdata.d4science.org/) and access the “City of Citizens” VRE.
Keywords
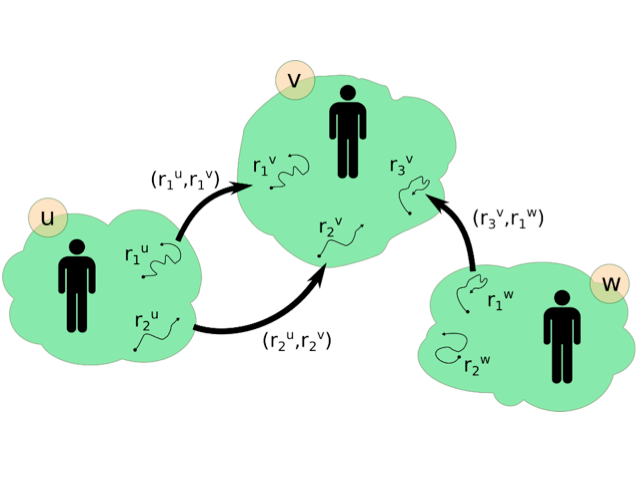
Individual Mobility Networks (IMNs)
They are a network representation of the overall mobility of a user that describes the places she visited and the trips she performed, highlighting the frequency of behaviours. IMNs are the basis for deep understanding the personal mobility of a user, enabling several analyses and applications.
Mobility Profiles
A mobility profile summarizes the systematic mobility of a user, basically identifying and summarizing her routines, i.e. trips performed virtually every day at the same hour.
Activity Recognition
It consists in recognizing the purpose of any trip performed by a user. This is a challenging task, especially when the only available information are trips themselves. KDD Lab developed methods that exploit a user-centric view of trips, based on Individual Mobility Networks, yielding very good accuracies.
T-Clustering
Trajectory Clustering (T-Clustering in short) is the task of grouping a dataset of trajectories into homogeneous groups. Several instances of T-Clustering can be obtained by changing the criterion that makes two trajectories similar – having similar destination, or following a similar path, or moving in the same places at the same time of the day.
T-Patterns
Trajectory Patterns (T-Patterns in short) represent a particular type of sequential pattern, consisting of sequences of places visited by a large number of trajectories with specific transition times (automatically detected by the algorithms).
Sociometer
Approach for assigning a user to a given category of “city user”, such as “resident”, “commuter” and “visitor”. The method is based on aggregated mobile phone CDR data.
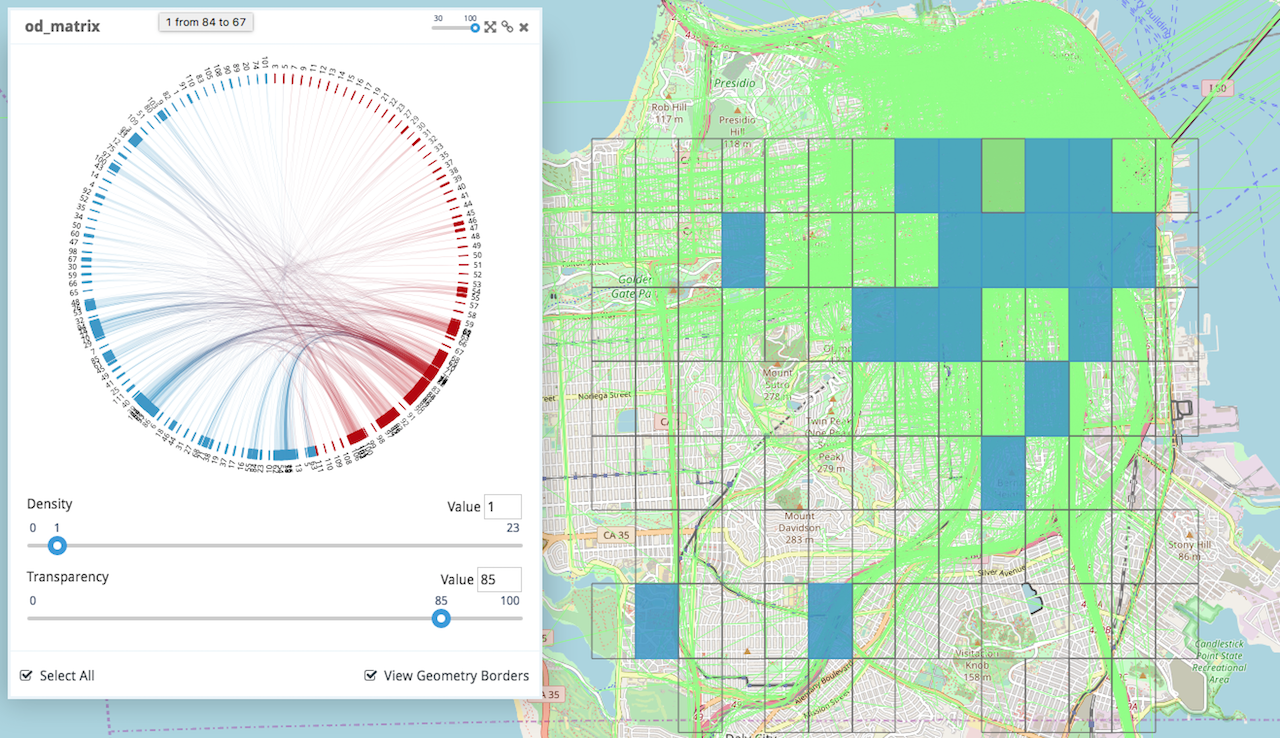
Origin-Destination Matrix
This is a traditional tool of transportation scientists, consisting of a table that summarizes the (expected) flows of people moving between each possible pair of geographical regions within a given area. O-D Matrices can be estimated either through traditional surveys, or by leveraging mobility data sources such as GPS tracks or mobile phone data.
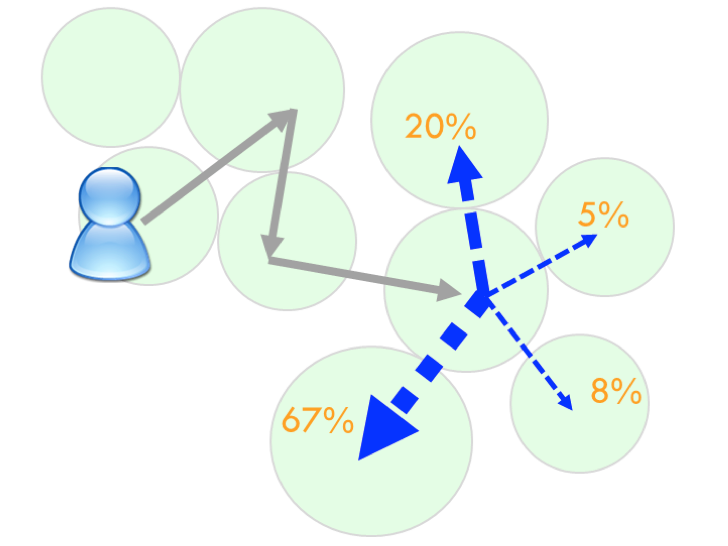
Mobility Prediction
This is the problem of predicting how an ongoing trip of a user will continue, thus including the prediction of the destination (classical versions of the problem usually are limited to this) and the path that will be followed. Several applications are based on mobility prediction, such as traffic forecasts and smart advertising.
Projects
Publications
2025
-
, “Optimization of Exposure-Aware Routing for Vehicles and Pedestrians”, in Proceedings of the 19th International Symposium on Spatial and Temporal Data (SSTD '25), Osaka, Japan, 2025.
-
, “Exploiting Vehicular Data for Exposure-Aware Pedestrian Routing”, in 2025 26th IEEE International Conference on Mobile Data Management (MDM), 2025.
-
, “From GPS Traces to Individual Emission Exposure: A Data-Driven Four-Step Process”, in Intelligent Transport Systems, Cham, 2025.
-
, “Vehicle-Pedestrian Optimization Framework for Exposure-Aware Routing”, Mobile Networks and Applications, 2025.
2023
-
, “Analysis, Prediction and Mitigation of Exposure to Vehicular Air Pollution Based on Multi-Source Urban Data”, in SEBD 2023: 31st Symposium on Advanced Database Systems, Galzignano Terme (PD), Italy, July 2–5, 2023, 2023.
-
, “Mobility Constraints in Segregation Models”, Scientific Reports, vol. 13, p. 12087, 2023.
2022
-
, “Generating mobility networks with generative adversarial networks”, EPJ data science, vol. 11, p. 58, 2022.
2020
-
, “Predicting and Explaining Privacy Risk Exposure in Mobility Data”, in Discovery Science, Cham, 2020.
-
“(So) Big Data and the transformation of the city”, International Journal of Data Science and Analytics, 2020.
-
, “Modelling Human Mobility considering Spatial, Temporal and Social Dimensions”, arXiv preprint arXiv:2007.02371, 2020.
2019
-
, “Human Mobility from theory to practice: Data, Models and Applications”, in Companion of The 2019 World Wide Web Conference, WWW 2019, San Francisco, CA, USA, May 13-17, 2019., 2019.
2018
-
, “Discovering Mobility Functional Areas: A Mobility Data Analysis Approach”, in International Workshop on Complex Networks, 2018.
-
, “Diffusive Phenomena in Dynamic Networks: a data-driven study”, in International Conference on Complex Networks CompleNet, Boston March 5-8 2018, 2018.
-
, “Analyzing Privacy Risk in Human Mobility Data”, in Software Technologies: Applications and Foundations - STAF 2018 Collocated Workshops, Toulouse, France, June 25-29, 2018, Revised Selected Papers, 2018.